Each spring, New Jersey students sit for the NJSLA, and months later the results arrive. It's easy to picture that data as a single headline score, proficient or not, that lands in a report and goes no further. In a well-run school, though, state results are one part of a much larger, year-round process.
The starting point is a principle educators have long understood: assessment isn't separate from instruction, it's an essential part of it. Without some way to check what students have learned, teaching becomes a one-way activity, delivering content with no reliable signal about what was retained.

Formative, benchmark and summative
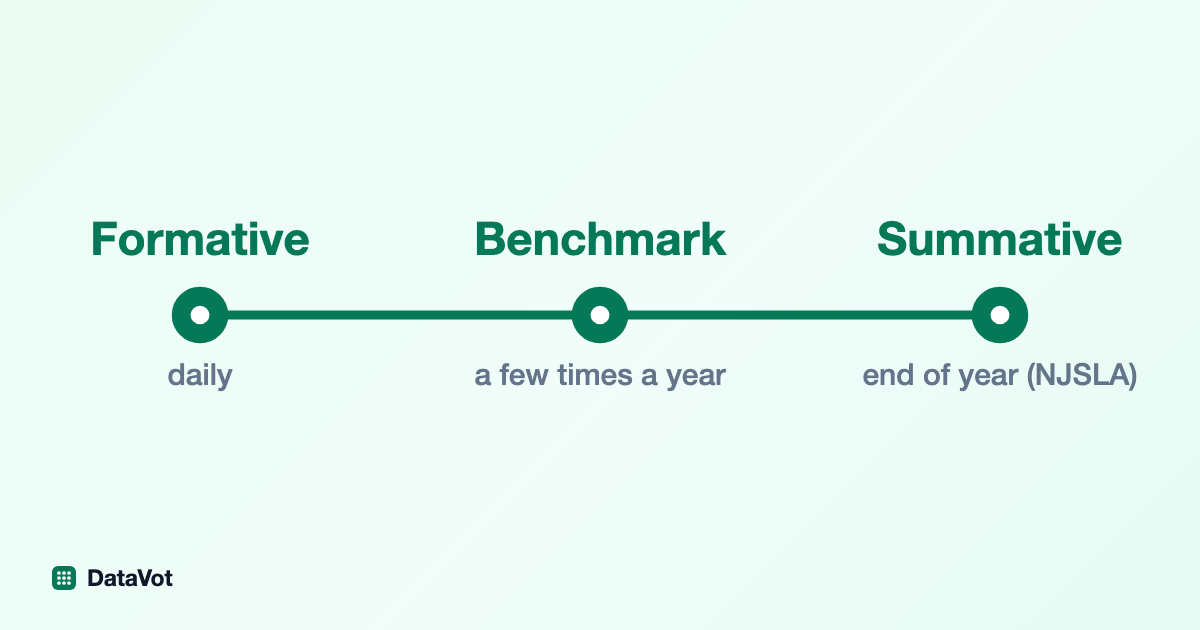
State testing is sometimes imagined as the only assessment a child takes. In practice, a strong classroom relies on a continuous cycle of three distinct kinds of assessment:
- Formative assessment (daily): This happens minute by minute, through exit tickets, class discussion, thumbs-up/thumbs-down checks, and short quizzes. It tells the teacher, right then, whether students understood today's lesson or whether it needs to be re-taught tomorrow.
- Benchmark / diagnostic assessment (periodic): Given a few times a year (such as MAP or i-Ready), these show growth over months and help teachers group students for targeted reading or math support.
- Summative assessment (end of unit or year): This includes chapter tests, final projects, and state assessments like the NJSLA. It measures cumulative mastery of grade-level standards over a longer period.
What state assessments add
State assessments aren't meant to replace a teacher's daily grading or professional judgment, and they were never designed to be the only window into a child's learning. What they add is a common, standardized baseline. Classroom grades are invaluable, but they can vary from teacher to teacher and school to school. A state assessment looks at the same grade-level standards in the same way for everyone, giving a macro-level check on how well instruction is aligning with what students are expected to learn.
Used alongside everything else a school knows about a student, that shared yardstick makes a few things possible that classroom data alone cannot.

From results to better teaching
1. Seeing curriculum and equity clearly
Because state data uses a common measure, it helps leaders see whether a curriculum is working across the board, not just in the classrooms where grading runs generous. When results are broken out by school, grade, and student group, a curriculum director can spot whether a particular math or reading program is serving every group of students, or whether a gap is quietly widening for some. That visibility is the first step toward addressing it.
2. Giving the next teacher a head start
State assessments report more than a pass or fail: they break performance into sub-claims, for example a student's ability to express mathematical reasoning, or their proficiency with informational text versus literature. When a teacher receives a new roster in the fall, those breakdowns offer a useful starting picture of where a GROUP is stronger and weaker, which a teacher can then check against their own evidence. They are not a diagnosis of an individual student: a single subclaim rests on too few items to carry that weight, as the subclaim data itself shows, rather than spending weeks rediscovering them.
3. Informing conversations beyond the classroom
Clear, standardized results also support the conversations schools have with their boards, their communities, and their states, about where students are growing, where more support is needed, and how resources should be directed. Data turns those discussions from impressions into evidence. In New Jersey much of that reporting is published in the annual School Performance Reports.

Turning data into action
The catch is that this value only materializes if the data is actually usable. A raw state file with thousands of rows, and column names that change from one testing cycle to the next, is hard to turn into anything a teacher can act on by Monday. That's the gap DataVot is built to close: it validates each official file against the correct blueprint, lets a school map differently-named columns across years to a shared field, and turns the result into dashboards and reports that schools can read at a glance and share securely. The column matching itself is still a decision someone makes, not something the software infers on its own. (See also: Beyond the Spreadsheet, Understanding the NJSLA, and Multi-Year NJSLA Comparisons Start With a Column-Naming Problem.)
What a single score can and cannot tell you
A state score, on its own, is just a number. Its real value lies in how a school uses it: as one part of a continuous cycle of assessment, a common baseline that complements everything teachers already know, and a starting point for supporting each student. Read clearly and paired with classroom data, that score tells a teacher where to focus first.