When NJSLA-Adaptive (NJSLA-A) results arrive, each student's report carries more than one overall performance level. It also reports reporting categories: groups of related skills within a subject. NJDOE's FAQ gives Reading as an example, with three categories: Reading Literary Text, Reading Informational Text, and Language. The categories for every test are listed in the ELA and mathematics blueprints.
This is for New Jersey test coordinators, curriculum directors and teachers who want to use the reporting categories for instructional grouping.
It is tempting to look at these categories once and then move on to the overall level for reporting and board presentations. That is an understandable response to a real constraint. The overall level is a single, well-defined result. Category data is harder to summarize, and it rarely arrives in a form ready for instructional use.
What the categories report
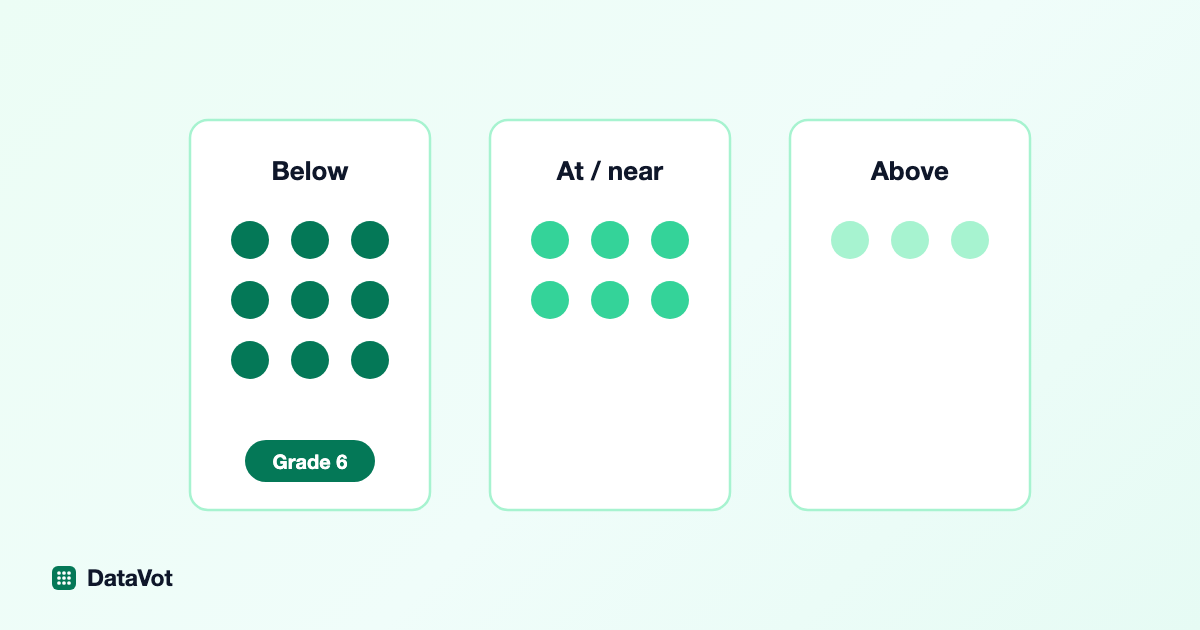
The overall result has five ordered performance levels, which are easy to chart. Reporting categories work differently. The 2026 NJSLA Score Interpretation Guide gives each category three levels: Below Expectations, Near or Within Expectations and Above Expectations. It says these levels “indicate how the student performed in each category relative to the overall performance of students.” On the student report they appear as an exclamation point, a two-way arrow and a checkmark.
Two things follow. First, these are ordered labels, not numbers. Coding Below, Near or Within and Above as 1, 2 and 3 and then averaging them produces a figure the test never measured. Report how many students fall in each level instead.
Second, the middle level is wide, and it is not the same as proficient. It covers students near the expectation as well as those within it. NJDOE's FAQ shows the consequence for the graduation test, the NJGPA-A, where the middle level is called Within Expectations: a student can be Within Expectations in every category and still be Not Yet Graduation Ready. On the NJSLA-A, a class that is mostly Near or Within is not the same as a class that is mostly proficient, so read the categories beside the overall levels, not instead of them.
Read categories for groups, not individual students
A reporting category covers only part of a test, so it rests on fewer questions than the overall score. NJDOE also stresses that a state test is a one-time snapshot and should be read alongside classroom work, local assessments and teacher observation. For one student, a single category label is a weak signal. It can change from one year to the next without any real change in that student's skill.
For a group, it is more useful. If most students in a grade land Below Expectations in the same category, that pattern says something about instruction, even though no single student's label would support that conclusion on its own.
Describe the pattern precisely. Comparing this year's fourth grade to last year's fourth grade compares two different groups of students. Growth means following the same students across years. The two are easy to present as one another, and they support different conclusions.
Building instructional groups
Start with the category label itself, not a derived number. Match it to the class roster for one grade and one category at a time, and sort students into three groups: Below, Near or Within, and Above Expectations. The result is a grouping list based on questions students actually answered, rather than on memory of who seemed behind earlier in the year.
Build the list at the classroom level, where it can inform intervention scheduling directly. A district-level summary suits a board presentation, but it won't tell a teacher which students in a given class need support on informational text. Build it by category rather than by overall level as well. Two students at the same overall level can land in different categories, and grouping only by overall level puts students with different needs in the same intervention block.
Where the workflow breaks down
Matching category data to a current roster depends on accurate student identification. NJSLEDS Student Management, formerly SID Management in NJ SMART, assigns each student a State ID (SID) meant to follow the student across districts. A transfer that hasn't been resolved can still require a manual match. Students who were absent or did not test will have no category results at all. None of this invalidates the approach. It means the groups are a starting point that a teacher adjusts using what they know about their students.
Grouping lists that name individual students are education records under FERPA, not aggregate reporting. Share them only with the teacher responsible for that roster, not through a shared folder with broad access.
A practical starting point
When this year's results arrive, try the approach on one grade and one category before rolling it out more widely. Compare the grouping list against the teacher's own read of student needs. That comparison shows whether the category data is telling the teacher anything they didn't already know. NJDOE's NJSLA Score Interpretation Guide explains the score report in full.
Related reading: Comparing NJSLA Results Across Years · How Schools Actually Use State Assessment Data