For New Jersey district and school leaders, testing coordinators, and anyone who will put Spring 2026 NJSLA-Adaptive results on a board slide next to prior years.
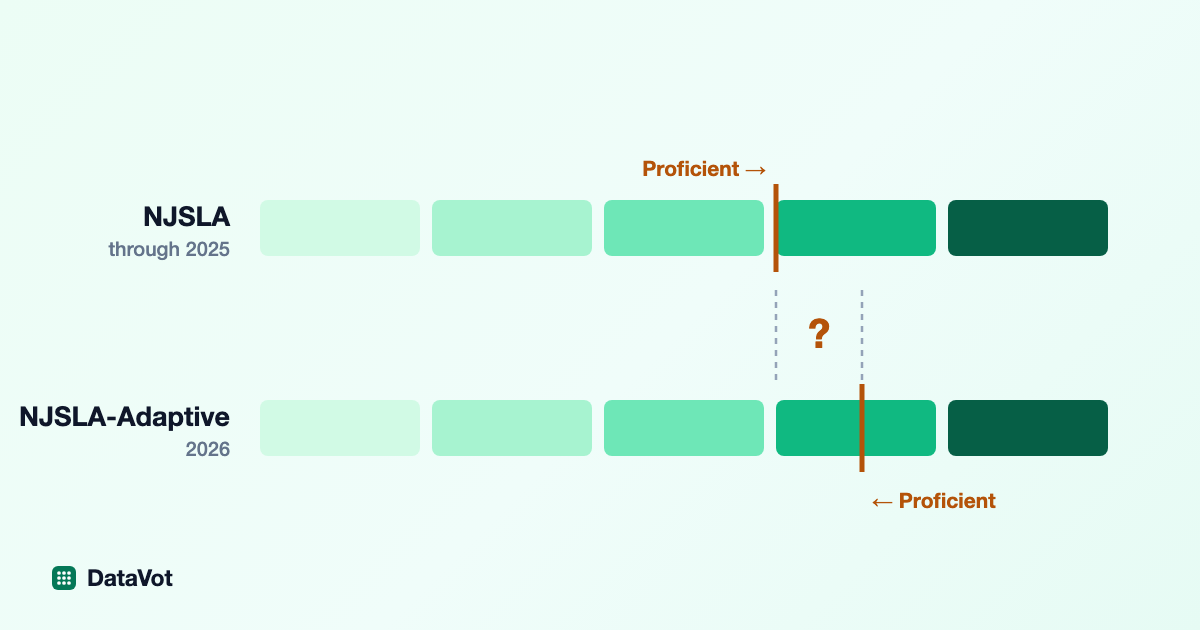
Sometime this school year, a New Jersey district will build a slide with a decade of state-test proficiency rates on it, and the last bar will come from a different test. The NJSLA-Adaptive (NJSLA-A) replaced the fixed-form NJSLA in Spring 2026. NJDOE's NJSLA-Adaptive and NJGPA-Adaptive FAQ lists the Spring 2026 NJSLA-A results for release in "Fall 2026," later than in past years, because new performance standards had to be set first. (The graduation test, the NJGPA-Adaptive, is on its own track: its Spring 2026 results were released on August 17, 2026. This article is about the NJSLA-A.)
If the 2026 bar sits lower than 2025, a board member will ask whether achievement fell or the test changed. The answer depends on evidence that has not been published.
The question here is not whether the new assessment works. Items can be sound, the platform stable, and the scoring defensible, and the new test can still fail to line up with the one it replaced. Only that second claim carries a trend line. (Whether adaptive testing measures better is taken up in The Great NJSLA-Adaptive Debate.)
Why the comparison is harder than it looks
When a school replaces an old scale with a new one, it can check the new scale by weighing a chair on both. The chair does not change between readings, so matching readings mean matching scales. Students are not chairs. They learn, forget, change schools, and get different instruction between two administrations. When an old-test score and a new-test score disagree, the gap mixes real change in the student with any difference between the instruments, and the two numbers alone cannot separate them. The same holds when they agree: a student who is proficient on both tests may have improved on a test that ran slightly harder. A matching label is not evidence of a matching scale.
That does not make comparison impossible. It means the analysis has to account for a moving target, which is ordinary work in educational measurement, and the work has to be done and shown.
The trap: proving what you already assumed
Suppose the only argument offered for comparability is that roughly the same share of students came out proficient under both tests. Similar rates are what you would expect if the two scales correspond. They are also what you would expect if the cut was placed where it produces a familiar-looking number. The observation fits both explanations, so it tests neither. If cut scores are chosen, even informally, to land near prior rates, the trend line is flat by construction.
What breaks the loop is a linking design settled in advance. Such a design does not reach outside the tests for the truth; no procedure yields a student's "real" achievement for two scales to be scored against. Its value is that it can come out badly. It can show the scales do not correspond, which is what separates a test of an assumption from a restatement of it.
The method NJDOE describes starts from written descriptions rather than from percentages. In its July 2026 standard-setting presentation to the State Board, educator panels assign written Performance Level Descriptors to test questions ordered from easiest to hardest, over rounds that include "individual judgments, group discussion, and data feedback." The presentation does not say what that data feedback contains, so whether panels saw how a proposed cut would compare with prior-year rates is not stated. Either way, standard setting does not establish how the new scale relates to the old one.
The cut that matters
On the fixed-form NJSLA, proficient meant Level 4 or 5. NJDOE's School Performance Reports reference guide says students “are considered proficient if they have met or exceeded expectations … which means they have a performance level of 4 or 5 on the NJSLA…” So the figure on the board slide is the share of students at Level 4 and above, and the whole trend line rides on one boundary, the cut between Level 3 and Level 4. Move that line slightly and the headline rate moves with it. The adaptive test keeps the same line: the 2026 NJSLA Score Interpretation Guide says its Percent Proficient column “shows the percentage of students who are in the ‘Met Expectations’ and ‘Exceeded Expectations’ performance levels.”
What the Fall 2025 field test established
The Fall 2025 administration was a field test, not an operational assessment. According to NJDOE's September 16, 2025 broadcast, students responded to items aligned to the prior grade level. The department's August 22, 2025 broadcast said results "are not provided to students, educators, or schools" and that a field test is given "to ensure that test items are valid, reliable, and fair for all students."
A field test shows whether items behave as intended, whether any perform differently across student groups, and whether items can be calibrated for operational use. Those are prerequisites for an operational test. What the design cannot do is put an old-test result and a new-test result side by side for the same student on the same content. It was not a comparison of the two tests.
Standard setting is not linking
These two pieces of work are easy to conflate, and the difference decides whether a trend line is legitimate.
Standard setting decides where the cuts fall on the new scale: what score a student needs to be called Level 4. The July 2026 presentation lays out five steps: develop Performance Level Descriptors, build Ordered Item Booklets from actual Spring 2026 student responses, convene panels of New Jersey educators, run structured rounds of judgment and discussion, and converge on recommended cut points.
Linking or equating asks whether the new score scale can be expressed in terms of the old one at all. That is what makes a ten-year trend line real, and it takes a design built for the purpose. The common designs are a set of items appearing on both forms, a group of students sitting both assessments, or an external measure the new scale can be checked against. Anchor items and common groups do not supply an independent reading of student achievement; they connect two measurement systems statistically. A common group sitting both tests months apart also brings back the moving-target problem, which is one reason a common-item design is attractive when it can be arranged.
The same presentation is direct about the discontinuity. The transition “introduces a new scoring scale,” and “prior fixed-form cut scores from the NJGPA and NJSLA no longer apply—new performance boundaries must be established before test results can be reported.” It also states that setting new standards “ensures test results are comparable, meaningful, and actionable,” and the FAQ describes the process as ensuring results are “meaningful, comparable, and aligned to expectations.” Neither document describes a linking or equating study connecting the new scale to the old one. A state can run a careful standard-setting process and still have no published basis for comparing this year's proficiency rate to last year's.
How far the public evidence goes
Published: the performance levels, the rationale for the change, the standard-setting method and timeline, and the field-test design. All of it is linked above.
Not published: any technical report showing that NJSLA-A scale scores can be placed on the fixed-form NJSLA scale. NJDOE's technical reports page lists annual reports for the fixed-form tests through 2025 and none yet for the adaptive tests. The FAQ and the standard-setting presentation both assert comparability without describing how it was established. Technical documentation often lags the administration it describes, so this is not proof the work is missing. It does mean a district cannot cite it today.
Not knowable from outside: the item pool, item-selection logic, and internal calibration work.
What to do with the slide
When the Spring 2026 NJSLA-A results arrive, a district can accurately report how many of its students landed in each performance level. Without published linking evidence, it cannot claim that a change from 2025 to 2026 measures a change in student achievement.
So show the 2026 results and mark the break in the series rather than drawing a continuous line across it. A footnote stating that 2026 reflects a new assessment with newly established performance standards describes what the data supports, and it is far easier to say in advance than to explain after a board has read a two-point drop as a decline in instruction.
If NJDOE publishes linking documentation before the presentation, the footnote changes. Watch NJDOE's technical reports page for it.
This is the harder of the two problems between a district and a multi-year chart. The other is mechanical: column names that drift between years will stop a comparison before the psychometrics come into play. A district can fix that one itself. It cannot fix this one.
New Jersey can validate an adaptive assessment, and the long-established fixed-form NJSLA is a reasonable reference to validate against. The open question is whether the public evidence shows that the new scale corresponds to the old one closely enough to carry a ten-year trend line. Today it does not, because that evidence has not been published. Achievement is not a chair that can be set on two scales and read twice.