One file. Your whole staff.
Every fall New Jersey sends your school one file containing every student's result from that spring's testing — every grade, every subject, every reporting category. Everything your school needs to know is already in that file. Nothing about the file tells you any of it. In most schools exactly one person ever opens it. DataVot adds no data of its own. It arranges what you already have, so the story that was always in the file becomes something a teacher, a principal and a board can read.
The problem is not the data. It is the queue.
The results arrive in a format built for machines. Someone capable opens the file, builds a handful of pivot tables, and sends screenshots. From then on every new question — a different grade, a different student group, last year compared with this year — goes back through that one person, who has a day job. Most of what the file could tell you is never asked.
What each person can do
For teachers
Answer your own questions instead of waiting in a queue.
- Open the official results your school has already uploaded — no file handling, no spreadsheet setup.
- Build a pivot table by choosing fields: any column as rows, any as columns, counts or averages as values.
- Save your own reports and reopen them whenever you like, up to the per-teacher number your district sets (twenty unless they change it).
- See only the students you are permitted to see.
For principals and supervisors
See your building in context, without asking anyone to build it.
- Put your building beside every other school in the district on one chart, where your district has given you access to the other schools.
- Break results out by subject, test code, year or performance level on the dashboard, and by grade in a report.
- Share a report school-wide so everyone reads the same numbers.
- Look at more than one year at once.
For the district office
Stop being the bottleneck.
- Upload each official data set once; everyone works from that same file.
- Decide exactly which schools each staff member can see — all, some, or none.
- Publish district-wide reports staff can open but not overwrite.
- Produce the tables a board presentation needs.
Dashboards
Performance levels by school, drawn from your own official data set. Aggregation happens on the server and returns counts only — raw student rows never reach the browser.
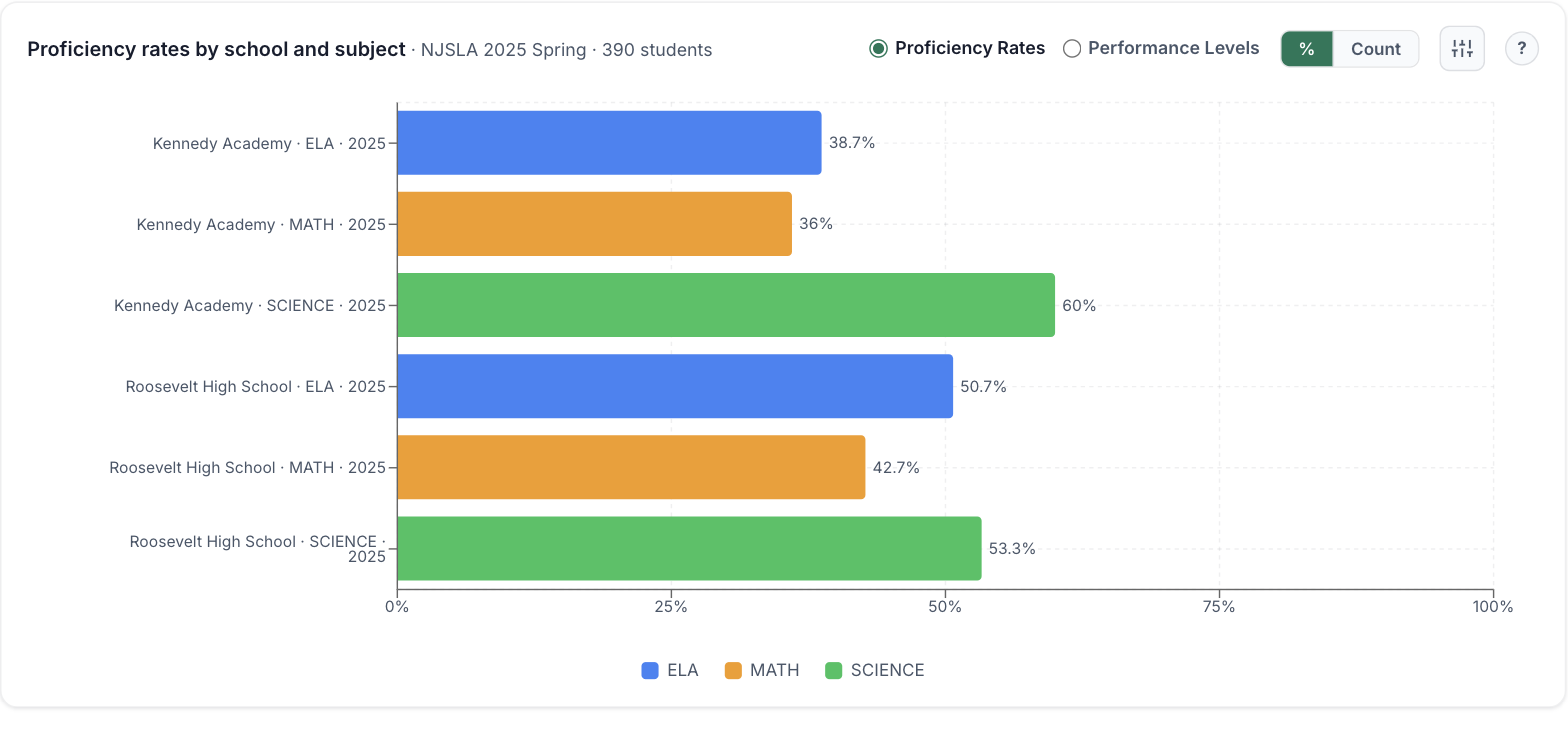
- Performance levels or proficiency rates. Switch between the full level breakdown and a single proficiency figure. The proficiency cut is a setting, not a guess.
- Counts or percentages, either way, without rebuilding anything.
- Split or combine any dimension. Break results out by school, year or test code — or roll them up. Subject always stays separate, because ELA and Math are different assessments and summing them would be meaningless.
- Chart controls that behave like a spreadsheet: orientation, clustering, sorting, color-by, data labels, legend and gridlines.
- A link you can send. Every selection lives in the address bar, so a chart is bookmarkable and a colleague opens exactly what you were looking at.
Reports that stay current
A saved report stores the layout rather than a copy of the data and points at its data set, so when that data set is updated or replaced, the report shows the new rows with nobody rebuilding it. If the range of your data grows, the report grows with it, and DataVot tells you plainly when the numbers underneath a report have changed. Each year’s results are a data set of their own, so a new year does not flow into last year’s report; it is brought in with Compare across years, which combines the years into one source you can break out by year.
Reports come in three kinds: your own, private to you; school reports, published across your district by an administrator and openable — but not overwritable — by everyone else; and starter reports we publish, which open against your district's own matching data set rather than ours, so a school has something to look at on day one without building it first.
Comparing years actually works
Year-over-year comparison usually breaks on something dull: the state renamed a column, so last year's Performance Level is this year's Level and the two files will not line up. DataVot does the tedious half for you. Columns with the same name across years are lined up automatically; columns whose names differ but clearly describe the same field are suggested as one field for you to confirm or split apart; anything DataVot cannot place is shown so you can line it up by hand.
What it deliberately will not do is silently fuse two differently-named columns. A suggestion you have to accept takes a few clicks; a wrong merge nobody was asked about is a trend line that is quietly false, which is the worse of the two failures.
The rest of what a report can do
The pivot table is the part people picture, so it is the part described above. These are the things a teacher finds in week two and nobody thinks to put in a brochure.
- Chart any report. Switch a table to a bar, line, area or scatter chart — bars grouped, stacked or 100% stacked — with your own title, axis labels, series colours, value labels and legend placement.
- Click a number to see what is behind it. Any cell opens the underlying records, searchable and sortable, so “why is this figure 34?” is a click rather than a question. A teacher only ever sees rows they are permitted to see, here as everywhere.
- Take it with you. Any report exports to CSV or Word. The records behind a single cell export the same way, and print cleanly to PDF.
- Build fields the file does not contain. Group scores into bands, derive a new number from existing columns, or correct a column DataVot read as text when it is really numeric.
- Make it readable. Colour values that cross a threshold, set decimals and percent formatting, turn totals on or off, resize columns.
- Filter and search inside a report, without rebuilding it or touching the source file.
Who sees what
The first question anyone sensible asks about opening student data to staff.
- Every staff member is scoped. A teacher can be given all schools, specific schools, or none — set per person, changed at any time.
- Sharing is a school setting. If you would rather teachers could not publish school-wide reports, turn it off — they can still build and save their own.
- So is how many reports each teacher may keep — twenty unless you change it, and yours to raise or lower.
- Administrators can see the activity log for everyone in their district — sign-ins, uploads, reports saved and deleted, and every change to who may see what. It records the action, never a student's name or row, so the log itself is safe to read.
- Support access needs your consent. If we ever need to look at your account to help, it takes a short-lived, audited session that never uses or reveals your password, and a banner shows while it is active.
- Student data is encrypted at rest, and dashboards return aggregated counts rather than student rows.
We will sign your data privacy agreement, or the New Jersey SDPC agreement, before any student data is uploaded. See the Data Privacy Agreement and the School Data Assurance Letter. The Security Overview answers most of what a district questionnaire asks before anyone has to send one.
Board reporting
New Jersey requires results to be presented to the board at a public meeting, and NJQSAC asks for disaggregated student-group data with trend and comparative analysis on top of that. DataVot builds those tables from your own file — including statewide comparison figures published by the state — ready to paste into the department's own template.
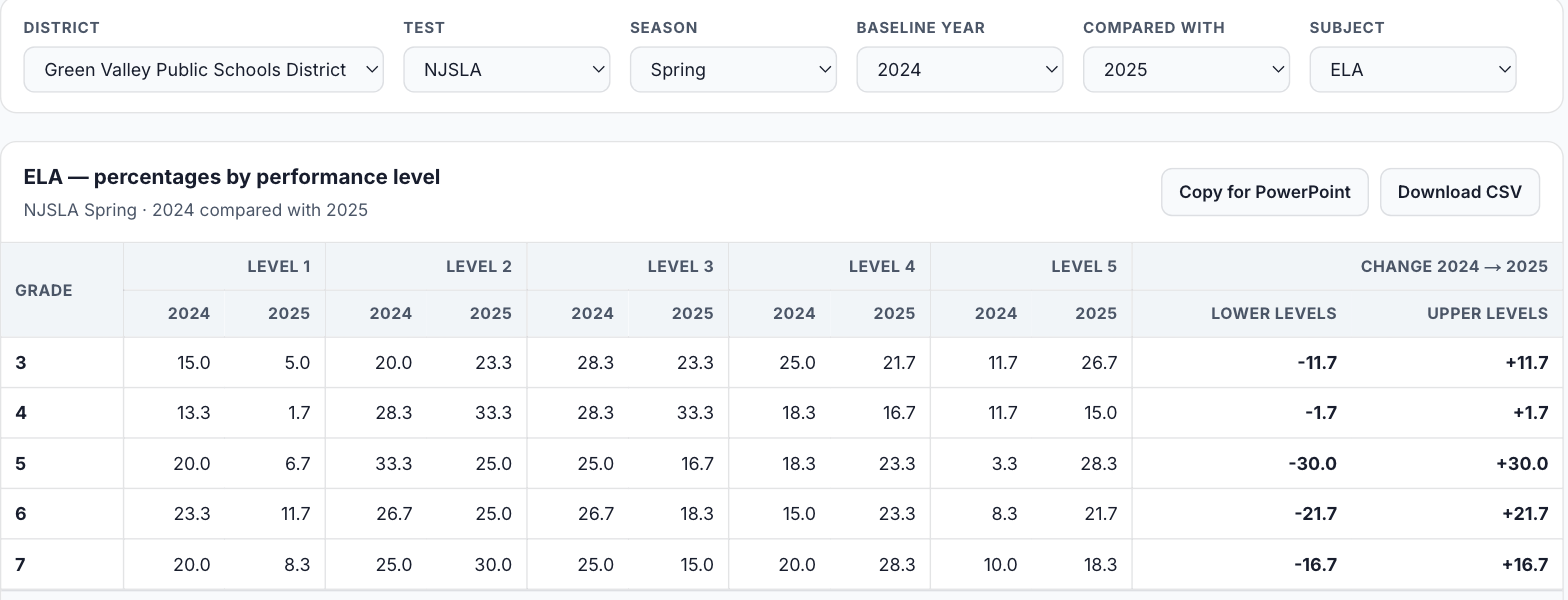
Two things worth knowing before you count on it. The template is built around year-over-year change, so it fills in properly once you have two years of results uploaded; in your first year the current-year tables are there and the comparison columns wait for the second file. NJDOE publishes statewide figures in the autumn following a spring administration, so a presentation given before they are out has no state column for the year being presented — the page says so rather than drawing an empty one.
Board tables are built by administrators, deliberately not teachers: a teacher restricted to some schools would produce a district table quietly missing the rest.
This is one output among many. The point of the tool is the rest of the year.
Try it before you talk to anyone
You can open DataVot without an account, upload a file, and build a table. Nothing is stored and no report is saved until you sign in — it is there so you can see how it behaves before committing anyone's time.
If you get past that, Getting started sets out what starting actually takes and which parts are ours rather than yours, and Questions and answers covers what your board is likely to ask — including what DataVot deliberately does not do.
What it costs
One plan, one price, no tier to compare and no module sold separately. The figures live in one place so they cannot drift apart: Pricing sets out the price, what it includes, what is never charged for, and how you pay. Every price is agreed in writing before anything is invoiced, and terms never renew automatically — each year is a decision you make, not one that happens to you.
Salesforce Hub LLC (makers of DataVot)
225 Arlington Avenue, Clifton, New Jersey 07011
info@datavot.com · https://datavot.com